The sampling in your Google Analytics account can be horribly inaccurate, and may dramatically skew the data that you rely on.
Does that get your attention?
What is data sampling?
As defined by Google:
“Sampling in Google Analytics (GA) or in any web-analytics software refers to the practise of selecting a subset of data from your website traffic and reporting on the trends available in that sample set. Sampling is widely used in statistical analysis because analysing a subset of data gives similar results to analysing all of the data.“
![]()
In other words if a non-standard query needs to reprocess a large dataset, Google may take a sample of data, rather than analyse the whole dataset itself.
Considering the fact that Analytics is a free service, this is quite reasonable.
However…
What constitutes a large dataset?
Google are a little vague about this:
“Specifically, GA inspects the number of visits for the specified date range at the web property level. If the number of visits to the web property in the given date range exceeds 250K visits, GA will employ a sampling algorithm which uses a sample set of 250K visits, proportional to the distribution of visits by day for the selected date range. Thus, the session sampling rate varies for every query depending on the number of visits included in the selected date range for the given web property.“
Again this seems reasonable, but Google are giving themselves a lot of wriggle room here. And this proved to be an issue.

The problem came to my attention when I looked at the levels of organic traffic for a website over the course of this year:

That looks quite bad, right?
So the next obvious step was to identify where the drop occurred, and then compare the before and after data to see which terms had fallen and/or which pages.
Finding the date was of course simple, but when I compared the data before and after the drop, I didn’t see what I expected:

The original graph showed a drop in organic traffic of over 97%, yet when comparing a week after the drop with a week before, the fall was just over 1%.
Sampling is pretty damn inaccurate!
Any form of sampling carries an inherent risk of inaccuracy, but the extent of the mismatching struck me as unacceptable.
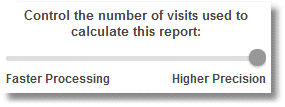
When I adjust the sample size, I get two very different patterns of data.
The first is is based on 81.33% of the visits:

I then increased the sample size; the second is based on 98.86% of the visits:
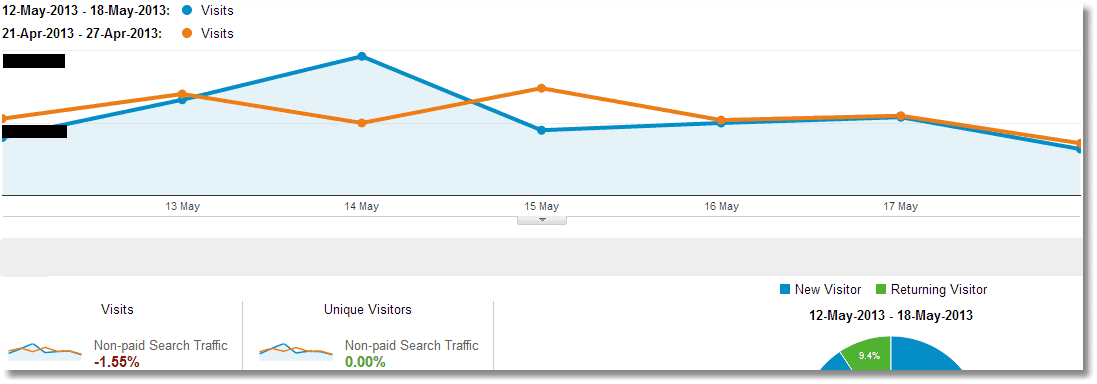
Despite only increasing the sample size from 81% to 99%, the results are dramatically different, with the resulting drop in traffic only being 1.6%, instead of 35%.
So back to the original data, if I then slide the sample size all the way up to the maximum, I get data based on an 88% sample:

There’s still a drop, but nothing like Analytics first showed me by default.
Takeaway lessons:
The sampling techniques employed by Google are inaccurate and must be viewed with great caution.
Always ensure that you sample the greatest size possible:
Even then pay close attention to what you’re looking at.
I chose higher precision (larger sample size) for another account, looking at organic data since the start of the year, and the report was based on a sample of less than 17%:

If you find the highest sample to be unacceptably low, look at smaller sets of data at a time.
Unique ideas for your business
The Demystifier puts practical ideas into your hands. You won't find them elsewhere. Original, actionable and insanely effective.