How to Be Confidently Wrong About Your Business
A small online store owner saw their sales jump 40% in November.
Excited by the growth, they quickly stocked up with far more inventory than usual, and upgraded to a more expensive tier on their e-commerce platform.
By February, they were struggling to pay bills and had excess stock.
What went wrong?
Should they have waited for a pattern and trend to emerge? Did they analyse normal trends enough?
This isn’t a story about bad luck or poor judgment.
It’s about a hidden problem that affects thousands of small business owners every day: data that looks trustworthy but tells a fundamentally false story.
The numbers were accurate.
Sales did increase 40% in November.
But the data was missing context, ignoring patterns, and obscuring the real reasons for the growth.
When we rely on incomplete information to make complete decisions, we’re not being data-driven – we’re being data-deceived.
The difference between the two can determine whether your business thrives or struggles to survive.
Here are the five most dangerous lies your data tells you:
The Mirage Effect – when a temporary spike looks like a surge.
The False Prophet – when correlation can trick you into expensive mistakes.
The Smooth Criminal – when healthy-looking numbers can hide problems.
The Isolation Lie – when focusing on one metric blinds you to issues elsewhere.
The Technology Lie – when platform changes make your data meaningless.
Each of these lies has caused serious pain to businesses that thought they were making data-driven decisions.
You might think you’d never make such obvious mistakes. But when you’re close to your data, you might be surprised.
1. The Mirage Effect
When “up and to the right” is actually “down and to the left”
Hypothetical Examples:
- An online craft supply store sees 200% growth in their first quarter. The reality: They launched during holiday craft fair season, and January to March showed a natural post-holiday decline.
- A course creator celebrates “explosive” 50% monthly enrolment growth. Truth: They’re counting free preview sign-ups that never convert to paid students.
- A local fitness instructor’s online booking calendar doubles in volume. The reason: Another instructor’s website went down, creating a temporary surge.
Real-World Patterns:
- Seasonal spikes mistaken for permanent growth.
- Social media algorithm changes causing artificial traffic boosts.
- Competitor website issues driving temporary traffic.
Key Insight:
Growth metrics are the most dangerous form of data deception.


Why? Because they can tempt small business owners into changing plans or expensive commitments based on temporary patterns.
Website Impact & Awareness:
Website traffic growth can deceive because it tends to combine multiple layers of deception. An online store might see 300% traffic growth, that’s actually:
- 50% from a viral social media post that won’t repeat.
- 30% from a popular blogger’s (one-time) mention.
- 15% from normal seasonal patterns.
- Only 5% sustainable customer base growth.
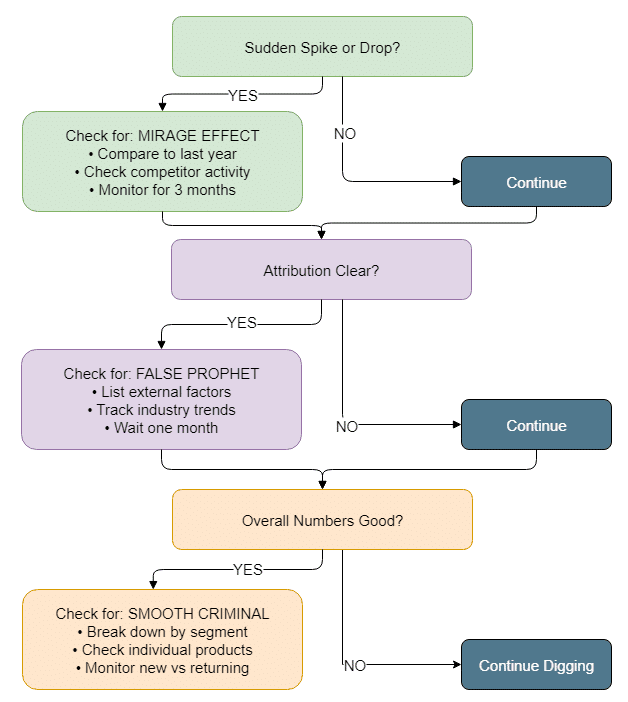
Practical Steps to Avoid This Mistake:
- Keep last year’s analytics screenshots.
- Track your competitors’ website status and major changes.
- Wait at least three months before making big inventory or platform decisions.
2. The False Prophet
When your data tells you “X caused Y” but reality is more complex
Hypothetical Examples:
- An online jewellery store doubled their ad spend and saw a 30% sales increase. Truth: A popular influencer wore similar styles that week.
- A digital planner shop changed their product photos, sales jumped 40%. Truth: New year resolution season just started.
- A local music teacher lowers lesson prices, bookings double. Actually: School music program budget cuts sent students looking for private lessons.
Real-World Patterns:
- Social media trends driving sales unrelated to marketing efforts.
- Seasonal changes disguised as marketing successes.
- External events causing temporary demand spikes.
- Market changes coinciding with business decisions.
Key Insight:
For small online businesses, true causation is rare. Most “obvious” cause-and-effect relationships are part of larger patterns we can’t see.
Website Impact & Awareness:
Digital analytics create dangerous causation illusions. A product page might suddenly perform better because:
- A similar product went viral on social media.
- A major retailer sold out of competing items.
- A competitor raised their prices.
- Pinterest’s algorithm started favouring your types of images.
- A news story drove interest in your category.
- Seasonal shopping patterns aligned with your promotion.
Practical Steps to Avoid This Mistake:
- Join Facebook groups in your niche to spot trends.
- Keep a simple log of all changes you make.
- Wait at least a month before claiming success.
3. The Smooth Criminal
When aggregate data hides critical problems
Hypothetical Examples:
- An online store maintains steady sales numbers. Reality: Regular customers buy more, while new customer acquisition plummets.
- A digital product creator sees stable monthly revenue. Truth: Course sales dying while template sales boom.
- An Etsy seller’s conversion rate looks healthy. Actually: Bestseller converting at 10%, everything else at 1%.
Real-World Patterns:
- Single popular items masking poor overall performance.
- Loyal customer spending masks new customer acquisition problems.
- Combined metrics hiding product-level issues.
- Platform-wide averages hiding shop-specific problems.
Key Insight:
Averages are dangerous for small businesses because they can hide problems until they become critical.
Website Impact & Awareness:
Website averages combine vastly different experiences:
- Mobile vs desktop shoppers.
- First-time vs returning visitors.
- Social media vs search engine traffic.
- Different product categories.
- Different price points.
- Multiple traffic sources.
Practical Steps to Avoid This Mistake:
- Check individual product or service performance often, ideally weekly.
- Monitor new vs returning customer rates.
- Be aware of seven-day patterns and cycles.
4. The Isolation Lie
When focusing on one number blinds you to the whole picture
Hypothetical Examples:
- An online candle maker is delighted by rising order numbers, but misses that average order value dropped 60%.
- A print-on-demand website focuses on traffic growth, ignores falling conversion rates.
- A handmade jewellery seller maximises profit margins but loses market share to more affordable competitors.
Real-World Patterns:
- Traffic increases hiding revenue decreases.
- Order volume masking profit problems.
- Social media growth concealing sales decline.
- Review scores hiding customer retention issues.
- Healthy client levels hiding very low sales leads.
Key Insight:
Small business metrics are interconnected. Improving one can harm others in hidden ways. Digging beyond the superficial is vital.
Website Impact & Awareness:
Website metrics particularly suffer from isolation:
- High traffic might mean poor targeting.
- High traffic can mean poor quality.
- Strong conversion rates might mean weak prices.
- Low return rates might indicate poor customer loyalty.
- Good cart completion could mean missing upsell opportunities.
- High search rankings and traffic might come from wrong keywords.
Practical Steps to Avoid This Mistake:
- Track at least three related metrics for every change; choose them in advance.
- Check customer retention and acquisition.
- Review both traffic quality and quantity.
5. The Technology Lie
When digital platforms make your data look better (or worse) than reality
Hypothetical Examples:
- An Instagram shop’s reach triples after the platform changes how views are counted.
- A newsletter’s open rates crash after Apple’s privacy updates.
- An online teacher’s course completion rates drop after learning platform changes tracking method.
Real-World Patterns:
- Social media metrics changing without real audience changes.
- Email statistics becoming unreliable due to privacy updates.
- Shopping platform algorithm changes affecting visibility.
- Analytics tools counting traffic differently after updates.
Key Insight:
Small businesses rely on technology platforms that constantly change how they measure and report success, creating false patterns that look real.
Website Impact & Awareness:
Digital platforms create multiple layers of technical deception:
- Social media insight changes.
- Email tracking updates.
- Shopping platform modifications.
- Payment processor reporting shifts.
- Analytics tool updates.
Practical Steps to Avoid This Mistake:
- Join online communities in your niche (Reddit, Facebook groups etc.).
- Keep manual records of key numbers (website visitors, email list size, top sales figures). Keep it simple.
- Monitor actual sales, not just platform metrics.

Build a Truth-Seeking Business
The goal isn’t perfect data. That’s impossible.
Instead, build habits that:
- Question sudden changes.
- Compare multiple metrics.
- Keep historical records.
- Understand seasonal patterns.
- Track external factors.
Remember: Your data isn’t just incomplete; it’s actively deceiving you in predictable ways.
Base your decisions on this reality, and you’ll make better choices with the imperfect information you have.
Your Data Purification Plan:
Step 1: Choose your biggest risk:
- If you make quick decisions based on good news → Start with “The Mirage Effect”.
- If you often think “X caused Y” about your marketing → Focus on “The False Prophet”.
- If you track only 1-2 main metrics → Begin with “The Isolation Lie”.
- If you’ve been confused by sudden metric changes → Tackle “The Technology Lie”.
- If you rely heavily on platform analytics → Address “The Smooth Criminal”.
Step 2: Pick two practical steps (this week):
Choose the two easiest actions from your selected section. For example:
- Screenshot your current analytics & join one relevant Facebook group.
- Start a simple weekly tracking spreadsheet & keep a note of any external events.
- Check individual product performance and monitor mobile vs desktop separately.
Step 3: Build the habit (next 30 days):
- Set a weekly 15-minute “data digging” calendar reminder.
- Each week, ask: “What else could explain this number?” Be open to all alternatives.
- After 30 days, add two more practical steps from other sections.
Step 4: Expand your defence (month 2 – 3):
- Tackle a second “lie” that affects your business.
- Connect with other business owners who track similar metrics. Facebook, Reddit etc.
- Start questioning any data that seems either too good or too bad.
The 90-day goal: By the end of three months, you will hopefully automatically question sudden changes, keep simple manual records, and understand your seasonal patterns.
You won’t have perfect data, but you will have data literacy: the ability to spot when your numbers are lying, and investigate before making expensive or consequential decisions.
Emergency rule: Before making any decision that might impact more than 10% of your business, wait one week and check at least three different metrics. Your future self will thank you.
Successful businesses don’t have perfect data. They understand how their data deceives them.
Unique ideas for your business
The Demystifier puts practical ideas into your hands. You won't find them elsewhere. Original, actionable and insanely effective.